
Evolution of Analytics: From Static Dashboards to Generative UI
Explore the evolution of BI from static dashboards to dynamic AI dashboards powered by Generative UI. Learn how AI analytics agents generate real-time charts, insights, and interfaces tailored to every question without manual setup.

Your company spent months building the perfect analytics dashboard. Multiple stakeholders weighed in, designers crafted pixel-perfect charts, engineers built robust data pipelines, and product managers gathered requirements from every department. The result? A comprehensive overview of your business metrics that nobody actually uses.
Sound familiar? You're not alone. Despite the business intelligence market reaching $72.1 billion in global spending, only 29% of employees actively use analytics dashboards (IBM, 2024). The rest avoid them entirely or check in briefly before giving up in frustration.
The problem isn't your team's execution, it's the fundamental assumption that one dashboard can serve everyone's needs. When you try to build interfaces for all possible questions, you end up building interfaces that answer no one's questions well.
Consider what happens when your Head of Growth opens your carefully crafted dashboard and immediately wants to know: "Why did conversion rates drop 15% for mobile users from Germany last Tuesday?" Your beautiful dashboard shows conversion trends, but not with that specific breakdown. Not for that timeframe. Not with that geographic filter.
She needs answers now, not next sprint when engineering can build a custom view. This is the moment your analytics investment fails its most important test: enabling fast decisions when they matter most.
The Rigid Beginning : Traditional BI
Traditional dashboards suffer from what we call "anticipation paralysis", they can only answer questions you thought to ask when building them. Every chart, filter, and layout reflects assumptions about what users might need, frozen in time when requirements were gathered.
But business questions evolve faster than dashboard development cycles. Market conditions shift, user behavior changes, competitive pressures emerge, and suddenly your carefully planned metrics become irrelevant while the insights you desperately need remain buried in data you can't easily access.
This architectural limitation isn't just inconvenient, it's strategically dangerous. HG Insights reports that companies with higher BI adoption rates achieve 5x better performance in key business metrics, yet most organizations can't overcome the fundamental rigidity of static interfaces.
The Builders's Dilemma
Product Managers, Developers and designers face an impossible challenge with traditional analytics interfaces. How do you design for infinite possible questions? The typical solution is overwhelming complexity, dozens of filters, multiple chart types, endless configuration options that transform your clean interface into a digital cockpit that requires training to operate.
Users open these interfaces and immediately feel lost. Where's the insight they need? Which filter combination will give them the answer? How do they interpret these fifteen different chart types? The cognitive load of navigating the interface often exceeds the effort of finding insights within the data.
Research from the Nielsen Norman Group confirms this problem: complex dashboards create excessive cognitive load that actually impairs decision-making rather than improving it. Users spend more time figuring out how to use the tool than extracting value from their data.
Iteration Nightmare
Perhaps the most frustrating aspect of static dashboard architecture is the development bottleneck it creates. Every new business question requires engineering work. Every layout change needs development teams involvement. Every additional data source demands backend modifications.
This creates what Eckerson Group research identifies as the "expert bottleneck" business users can't get answers without technical specialists, and technical specialists can't scale to serve everyone's analytical needs. The result is a perpetual backlog of dashboard requests and frustrated stakeholders who can't get timely insights.
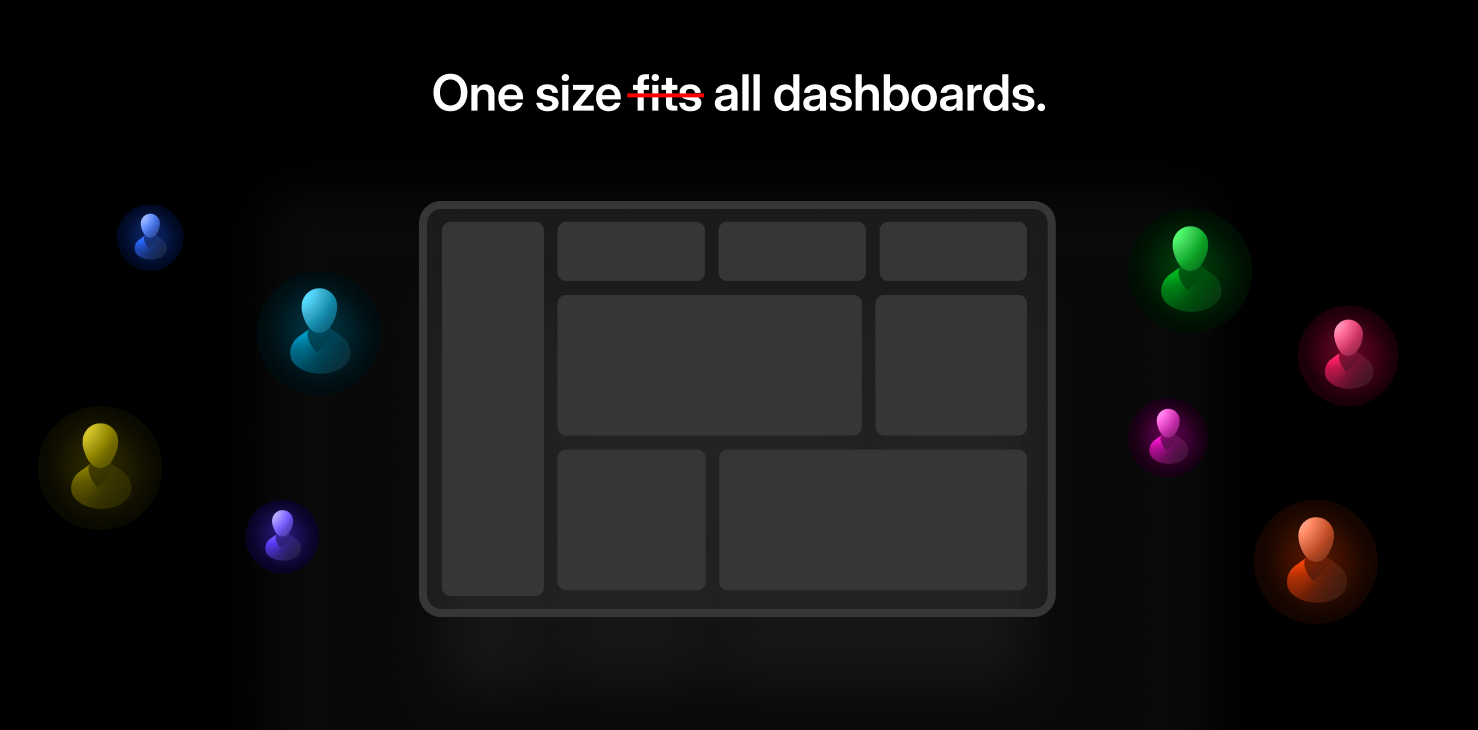
Teams end up building increasingly complex, "one-size-fits-all" interfaces that attempt to anticipate every possible use case. These mega-dashboards become maintenance nightmares, requiring constant updates as business requirements evolve and data sources change.
The Messy Middle: LLMs meet hardcoded UI
The advent of large language models seemed to solve the analytics accessibility problem. Suddenly, users could ask questions in natural language instead of learning complex interfaces. The conversational AI market has exploded to $15.5 billion in 2024, with projections reaching $132.86 billion by 2034, a 23.97% compound annual growth rate (Precedence Research, 2024).
Large language models unlocked a new way to interact with data. Suddenly, anyone could ask complex questions like “Show me retention by acquisition channel for users who signed up during our summer campaign” without needing to write SQL or understand database structures. It felt like having a conversation with your data, and tools quickly started evolving to support this shift. Users could now generate reports, summaries, or even calculations through simple, natural prompts.
Behind the scenes, this became even more powerful when combined with semantic layers. These layers gave the AI a clear understanding of business definitions and ensured consistent, reliable answers across different data sources. The LLM could focus on interpreting the user’s intent, while the semantic layer ensured the data stayed accurate and aligned. This pairing created a more accessible experience where business users could explore insights instantly, without technical friction or the risk of misinterpretation.
The LLM and UI mismatch
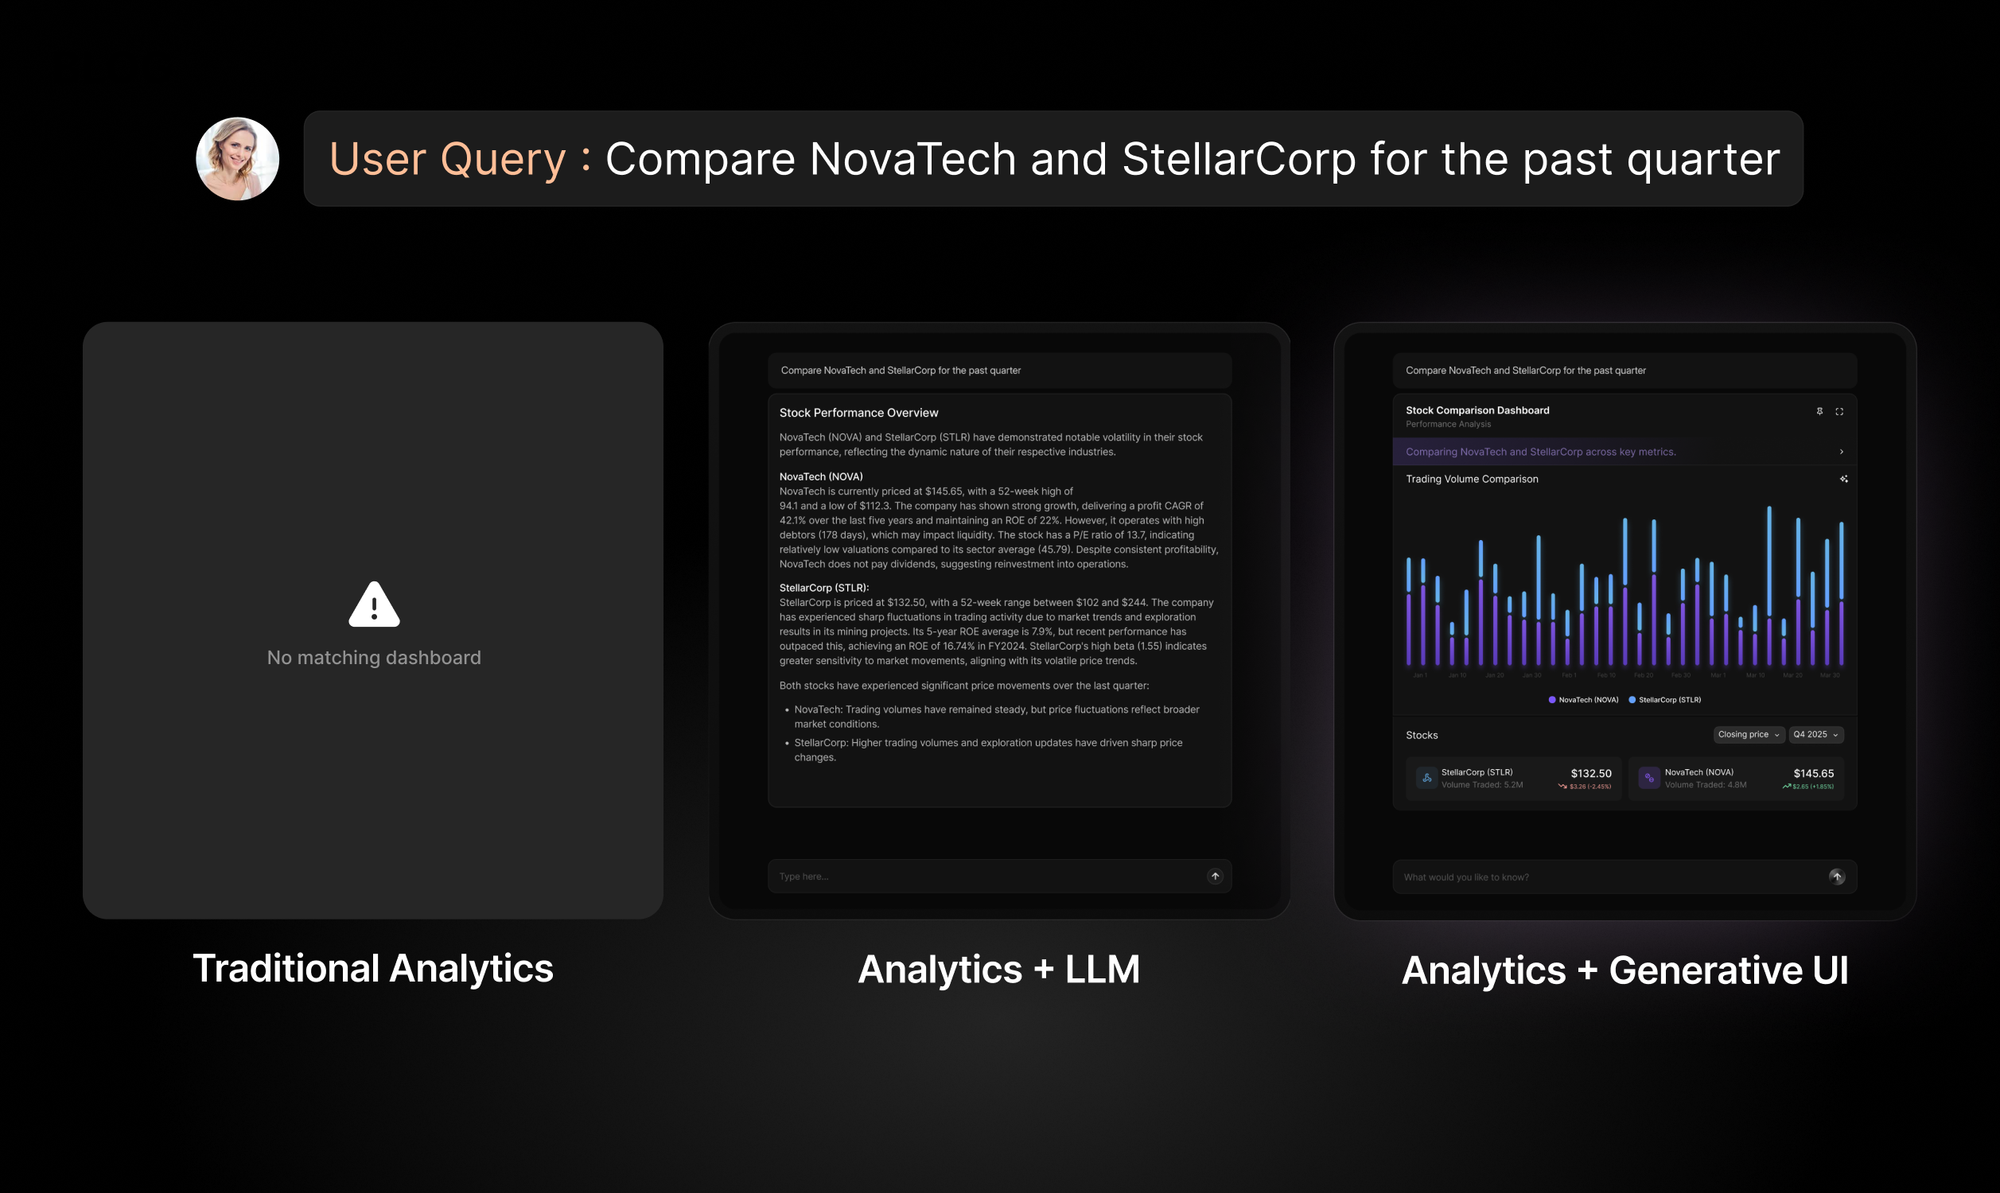
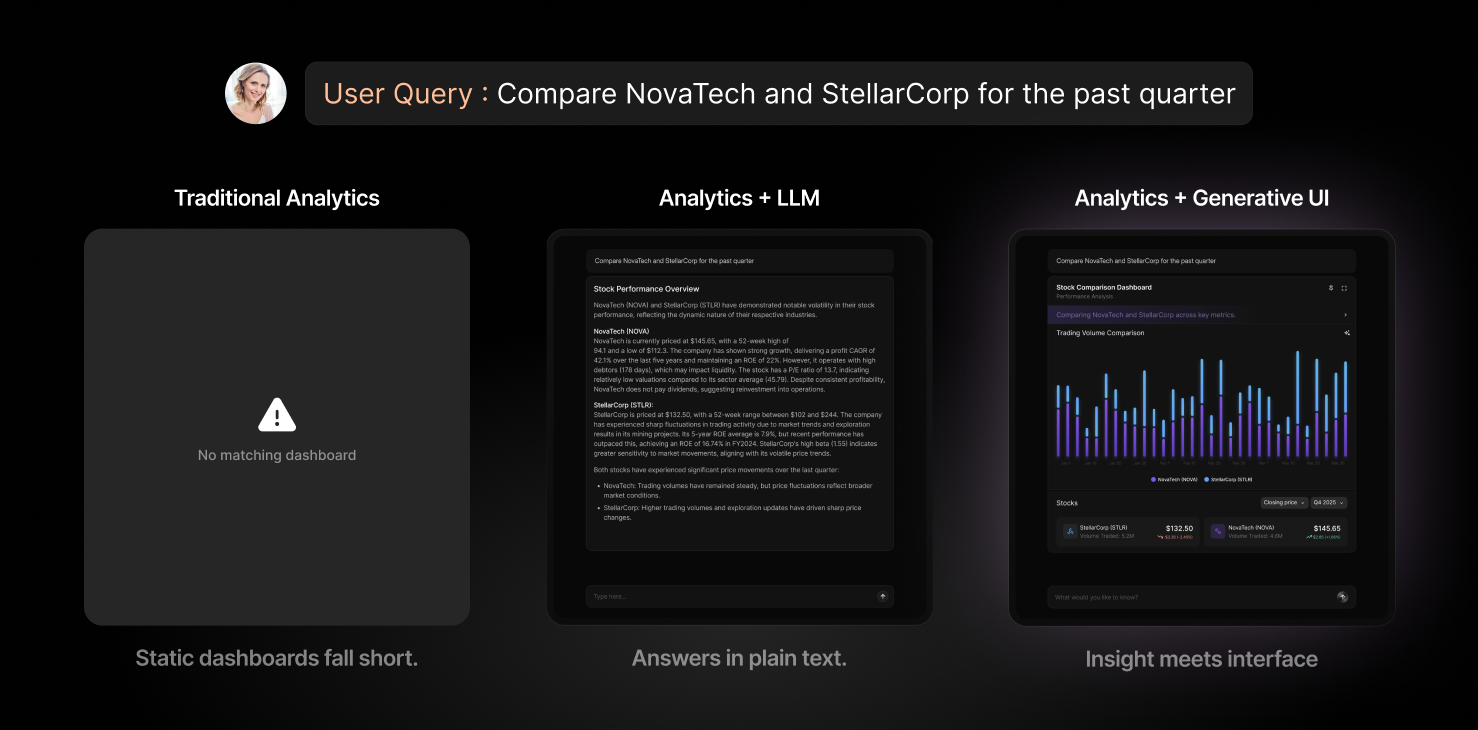
But here's where the promise hit reality: LLMs return text, not interfaces. Even the most sophisticated AI could analyze your data and generate perfect insights, but presenting those insights required falling back to static dashboard components.
Teams started hooking up their LLM backends to existing chart libraries and dashboard frameworks. This approach worked for simple visualizations, but quickly broke down when users asked complex, multi-faceted questions that required novel interface patterns.
Imagine asking "Compare our Q3 performance across regions, but highlight the impact of our September marketing campaign on customer acquisition costs." The LLM can perform this analysis perfectly, but your static component library only has predefined chart types: bar charts, line graphs, pie charts. None of these can optimally present the multi-dimensional insight the AI generated.
The Scaling Problem
The real issue emerged as usage scaled. Different users needed different presentations of the same insights. A CFO wanted executive summaries with high-level trends. A marketing manager needed detailed breakdowns with actionable next steps. A data analyst wanted access to the underlying calculations and assumptions.
With static components, you had three choices:
- Build separate interfaces for each user type (expensive and fragmented)
- Create complex, configurable templates (scaling and maintaining issues)
- Deliver text-only responses (losing the visual insight advantage)
None of these solutions addressed the core issue: static interfaces fundamentally can't scale with the infinite variability that LLMs enable. Your AI backend could generate any analysis, but your frontend could only display predetermined interface patterns.
This mismatch created a new kind of expert bottleneck. Instead of needing data analysts to write SQL queries, you needed front-end developers to build custom interfaces for every novel analytical scenario. The LLM solved the backend complexity but transferred the bottleneck to the presentation layer.
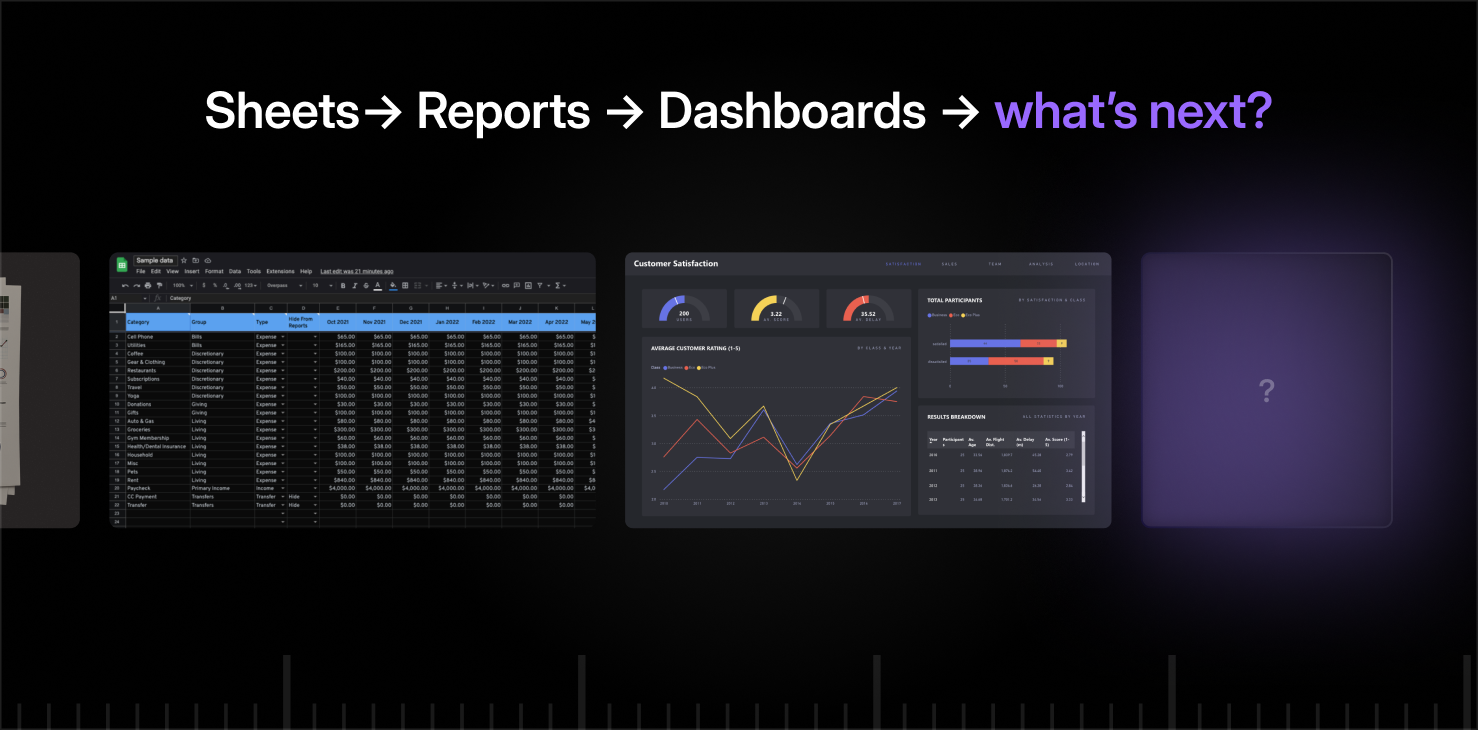
The Generative Future: UI built for GenAI Analytics
Generative UI is a new way of building interfaces where the UI is created by AI in real time. Instead of pre-designing screens or hardcoding dashboards, developers give the system a set of components and rules, and the AI builds the interface on the fly based on what the user needs. It’s like having a smart designer inside your app, creating the right layout, chart, or input field every time a user asks a question or takes an action.
This is a big step forward. Traditional UIs are static. They don’t adjust to different users, questions, or data. Generative UI is dynamic. It can understand intent, context, and data structure, then generate exactly the interface needed - whether it's a graph, a table, a form, or a multi-step flow. The result feels natural and personal, even though it’s built in real time.
Generative UI for Analytics
In analytics, Generative UI unlocks a completely new experience. Today, many AI tools can understand complex questions like “Can you show revenue by product category, stacked by region, for the last three quarters?” but they often respond with plain text or link to dashboards that don’t quite match the question.
With Generative UI, that same question triggers a different kind of response. Instead of static charts, the system generates a custom interface - maybe a stacked bar graph for acquisition channels with insightful summary folded into an accordion. It’s built instantly, using structured instructions from the AI and rendered live in the frontend. No templates, no delays, no extra effort from developers.
This works across all form factors. Whether the output shows up in a dashboard, a side-panel copilot, an automated report, or an embedded widget inside another app, the response is responsive, interactive and consistent. The user doesn’t have to dig for insights. The system brings the right view to them.
For developers, this also means they don’t have to pre-build dashboards for every possible use case. They just integrate once with the C1 API, and the system can handle infinite variations. The UI adapts with every question.
This is what Generative BI looks like.
Generative BI is an AI-driven approach to business intelligence where the system dynamically generates dashboards, charts, and insights in response to natural language queries - eliminating the need for predefined reports or manual exploration.
Advantages of Generative UI in Analytics
Engineering velocity improves quickly. Instead of spending weeks building dashboards, developers focus on business logic and let C1 generate the UI. Backend engineers can now deliver full analytics experiences without needing to hand off to frontend specialists. One logistics team reduced the size of their analytics group by 40 percent and still doubled their feature output. Another fintech company went from eight-week release cycles to under two weeks. By removing the need to design and maintain dozens of dashboards, teams also cut down on costs. An e-commerce platform saw a 60 percent drop in total cost of ownership after switching to Generative UI.
The user experience improves just as much. People engage more with analytics tools because the interfaces respond to their needs. In some cases, usage jumped 3 to 5 times. Instead of hunting through charts and filters, users get views tailored to their questions. One enterprise study showed users spent 75 percent less time navigating and 60 percent more time analyzing. Decision-making became faster, too. A retail company cut their time from insight to action from several days to a few hours simply by switching to an interface that adapted in real time.With C1, You’re generating graphs that look and feel like your product. Every UI element supports theming, so you can easily align the visual style of charts with your brand guidelines. Whether it's adjusting typography, colors, or spacing, the output adapts to your design system with minimal effort.
C1 also understands visual semantics. It automatically applies the right type of color palette for each use case, such as sequential palettes for trends over time, divergent palettes for highlighting deviations, and categorical palettes for comparing distinct groups. This isn't random styling. It's grounded in color theory and designed to improve readability and visual clarity. The result is not only smart UI, but beautiful and intuitive UI that scales with your product.
Generative UI isn’t just a more efficient way to show data. It’s the layer that finally connects AI’s intelligence with usable, practical interfaces. Static dashboards were built for known questions. Generative UI is built for what comes next. And with Thesys C1, any team can start building like that today.
Curious what a Generative UI powered Analytics co-pilot could look like? Check it out here - demo.thesys.dev
Get Started with Generative UI
Thesys is building the infrastructure that makes Generative UI practical for real-world analytics products. With our C1 API, AI tools can generate live, interactive user interfaces directly from LLM outputs. This removes the disconnect between smart AI responses and the rigid, static UIs users are often stuck with.
Whether you're building internal dashboards, customer-facing analytics, or embedded data products, C1 provides a scalable Generative UI layer that grows with your AI capabilities. It manages the complexity of interface generation while meeting the performance, security, and reliability standards expected in enterprise environments.
To learn more, visit Thesys or explore our developer docs to see how C1 can power your next analytics product.
References
Eckerson Group. (2022). "New Study Identifies Drivers of BI and Analytics Adoption in Companies Today." BARC Research.
Global Market Insights. (2024). "Conversational AI Market Size, Growth Analysis 2024-2032."
HG Insights. (2024). "Business Intelligence Market Size, Share, & Buyer Landscape."
IBM. (2024). "A new era in BI: Overcoming low adoption to make smart decisions accessible for all." IBM Think.
Microsoft Learn. (2024). "Overview of Copilot for Power BI." Retrieved from https://learn.microsoft.com/en-us/power-bi/create-reports/copilot-introduction
Nielsen Norman Group. (2024). "Minimize Cognitive Load to Maximize Usability."
Precedence Research. (2024). "Conversational AI Market Size and Forecast 2024 to 2034."
Pyramid Analytics. (2024). "What's the ceiling on the adoption of business intelligence?"